To begin examining what’s happening in the world of exchange-traded funds (ETFs), we surveyed the overall $10 trillion ETF landscape in our first article of this series, “Exploring the ETF Boom.” After more than $1.1 trillion flowed into ETFs in 2024 alone, the growth of this product category continues to reshape the investment industry. Morningstar currently lists 4,122 ETFs in the U.S. alone, and the number of ETFs is still growing steadily.1 Now that we have a solid understanding of the ETF industry’s expansion and development as a whole, let’s investigate how financial advisors are utilizing ETFs on the Envestnet platform. In this article, we’ll focus on the Advisor Model, Advisor Traded, and Unified Managed Account (UMA) programs unless otherwise noted.
ETF asset allocation
ETFs make up 26%-33% of AUM
A surprising 26% of client assets invested in funds or managed accounts are allocated to ETFs through the Envestnet platform.
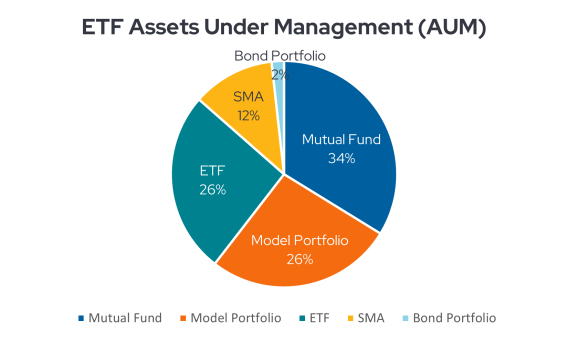
26% of client assets invested in funds or managed accounts are allocated to ETFs through the Envestnet platform. If we look at advisor programs where they have the ability to construct and manage their own portfolios for their clients, we find that 33% of client fund and managed account assets are invested in ETFs.2 Both of these figures illustrate that ETFs have become core tools for financial advisors and are essential to their clients’ portfolios.
Hedged Equity and Cryptocurrency ETFs are growing
When we rank asset classes by the amount of money advisors have allocated to them using ETFs, we find nine familiar categories…and one outlier.
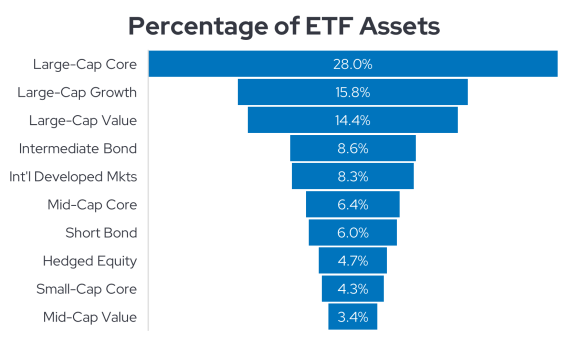
The first seven asset classes listed in the illustration above are traditional portfolio staples, as are the last two. Hedged Equity at #8 may not be as familiar. This asset class is largely comprised of ETFs that hold stocks and use options to generate additional income. Buffered products, which use derivatives to potentially hedge against stock market losses, fit into this asset class, too. Over the past twelve months, Hedged Equity has been the fastest growing of the top ten ETF asset classes on the platform.3 Its assets have risen 57% since February 28th, 2024.
Cryptocurrency ETFs are gathering assets on our platform, as well. Because the Securities and Exchange Commission only allowed ETFs to directly hold digital assets in January 2024, the 12-month growth rate for this asset class is just now becoming relevant, but still small relative to core asset classes on the platform.
ETF allocation is increasing compared to mutual funds
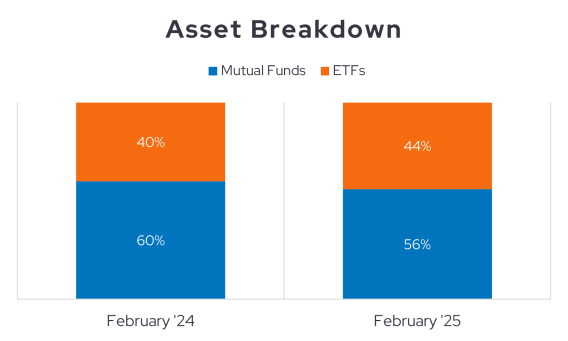
Before we turn to ETF flows, let’s assess how ETF assets under management (AUM) have grown in comparison with mutual fund AUM. In the Advisor Model, Advisor Traded, and UMA programs, mutual funds held 60% of the total assets allocated to either mutual funds or ETFs in February 2024. One year later, mutual funds hold 56% of these assets. Slowly but surely, ETFs are taking a larger piece of the AUM pie from mutual funds.
Trends within ETF flows
Now that we have analyzed the current state of ETF assets on our platform and detailed the growth of ETF AUM, we need to zoom in on the flows into these products. While total fund assets incorporate shifts in the value of underlying holdings, we can eliminate market fluctuations when we look at flow data. Imagine a fund that has $10 million in assets. $1 million flows out of the fund during a year while its holdings appreciate by $1 million during the same timeframe. The fund’s assets will still be $10 million at the end of the year even though it has suffered a $1 million outflow.
ETFs are experiencing net inflows
Let’s first explore how flows were divided between mutual funds and ETFs over the past two years. We discovered earlier that ETF assets were growing faster than mutual fund assets on our platform, and the flow data illuminates the reason for this differential. In the Advisor Model, Advisor Traded, and UMA programs, all of the trailing twelve-month net inflows going into funds went into ETFs.4 Mutual funds suffered net outflows during this timeframe. Mutual fund AUM in these programs, then, has increased over the last year only due to positive market returns, not positive net flows. ETFs, meanwhile, have benefited from market performance and significant net flows. When we parse the flow data even more deeply, two trends become apparent:
- Mutual funds are still receiving large monthly inflows through the Envestnet platform. The problem for mutual funds is that money is being withdrawn by some advisors even more quickly than others deposit money into these products. Mutual fund inflows only slightly trailed ETF inflows, but mutual fund outflows were far greater. This illustrates that mutual funds have an outflow problem more than they have an inflow problem.
- The shift to ETFs accelerated over the past year, especially in the last six months. Mutual fund monthly net flows shifted to even greater outflows in the Advisor Model, Advisor Traded, and UMA programs recently. ETF net flows just keep growing, though.
Active ETFs have the highest growth
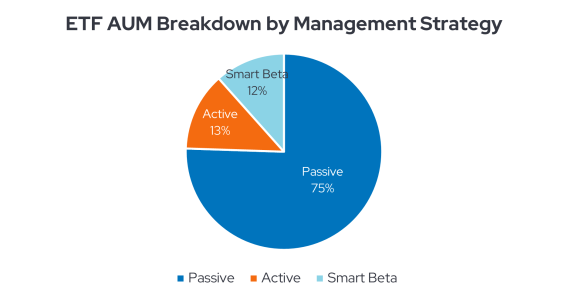
For a more complete perspective, we need to explore one more facet of the ETF story: Are advisors preferring active, passive, or smart beta strategies? (“Smart beta” is a synonym for “quantitative” or “factor” strategies.) If you know Envestnet, you know we have deep experience utilizing both active and passive strategies. That ActivePassive lens is an integral part of our work, so let’s see how platform flows are being split among active, passive, and smart beta ETFs.
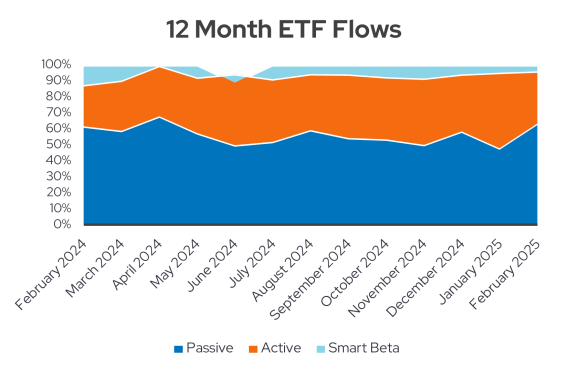
What conclusions can we draw from this data visualization? First, smart beta products are retaining a small sliver of platform flows but remain a relatively small slice of the ETF ecosystem. Passive strategies continue to draw the majority of ETF flows and remain very popular with financial advisors. Active ETFs have noticeably grown their share of flows, though. This Envestnet platform trend aligns with the overall industry growth of active ETFs and shows that advisors are becoming more interested in these products. If we look across the Envestnet platform, active ETFs still have a relatively small AUM footprint. Over the past twelve months, however, active ETF assets in three critical programs on-platform have grown 75%.5 That is well more than double the growth rate of passive ETF assets. Growing inflows, as we saw above, are driving these impressive gains in active ETF AUM.
Evolving ETFs
The ETF landscape continues to evolve in myriad ways, including on the Envestnet platform. We continue to utilize our leading analytics technology to monitor and analyze trends across the investment industry and regularly zero in on ETFs due to their growing popularity. Look for more updates on ETFs and other critical areas of the financial services ecosystem right here on our blog.
For more information on Envestnet | PMC’s ActivePassive investment strategies, visit https://www.envestnet.com/active-passive
