Envestnet | PMC is an industry pioneer in blending the two opposing investment styles: active and passive. We have been implementing this approach within our portfolios for more than 20 years. This investment methodology is in our DNA. We leverage Envestnet | PMC’s core competencies of manager research and due diligence, manager selection, asset allocation, and active/passive research to engage with our clients. We know active management is cyclical, but we are firm advocates of active strategies. We recognize the benefits of passive investing, too.
Market overview
Markets continued to demonstrate remarkable resilience and dynamism in the second quarter of 2024. Despite a significant pullback in April, U.S. and global equities rose for the quarter, bolstered by robust economic performance and impressive corporate earnings, particularly within the technology sector driven by advancements in artificial intelligence. Despite ongoing economic uncertainty, headwinds from rising interest rates, and an inverted yield curve signaling potential economic slowdowns, investor sentiment remained largely positive. Volatility ticked up slightly from the first quarter but stayed low compared to historical trends both in the U.S. and international stock markets. Emerging markets equities outperformed developed markets and large caps continued their upward trajectory, leaving smaller capitalization stocks behind. The S&P 500 Index gained 4.28% for the quarter, up 15.3% for the first six months of the year, against returns of 18.6% for the Nasdaq and 4.8% for the Dow Jones Industrial Average.
At its last meeting in June, the Federal Reserve (Fed) held interest rates steady, citing strong job gains and low unemployment as indicators of solid economic activity, while noting that inflation remains elevated despite easing. After peaking at 4.69% at the end of April, the 10-year U.S. Treasury yield closed the quarter at 4.36%, leaving the overall bond market roughly flat for the quarter. As of the end of June, the yield curve remained inverted, with the 2-year Treasuries offering a more attractive yield than longer dated issues. Bond markets recovered in the second quarter, boosted by improving inflation and a more confident outlook for rate cuts. Volatility in the bond market stayed above its five-year average and increased slightly from the first quarter as investors recalibrated their expectations for interest rate cuts from the Fed. Despite finishing the quarter narrowly in green, domestic fixed income outpaced global bonds, which posted negative returns, affected by the strength of the U.S. dollar. High-yield bonds outperformed investment-grade securities, while short-dated bonds continued to show resilience. Commodities posted positive returns for the quarter despite weakness in oil prices. The Bitcoin price fell, while gold and copper rebounded.
Our scorecard
Our ActivePassive Scorecard shows active funds beating their category benchmarks in 8 of the 19 asset classes tracked for the second quarter. Year-to-date, active funds are leading their category benchmarks in 12 of these analyzed asset classes. Over the last 12 months, active funds have outperformed in 9 of these asset classes.
The second quarter was a weaker period for active managers as they topped our category benchmarks in only 42% of the asset classes we track. Through the first half of 2024, however, active managers are ahead in 63% of the asset classes tracked for this scorecard. Over the past twelve months, active managers beat in nearly half of these category benchmarks. Let’s delve into the details of our scorecard.
U.S. Equity
| Active Fund Category | Qtr Return | Vs. Benchmark | YTD Return | Vs. Benchmark | TTM Return | Vs. Benchmark |
|---|---|---|---|---|---|---|
| Large Cap Core | 2.33% | -1.25% | 12.52% | -1.71% | 21.22% | -2.65% |
| Large Cap Growth | 4.79% | -3.54% | 17.65% | -3.05% | 29.18% | -4.30% |
| Large Cap Value | -1.46% | 0.71% | 7.43% | 0.81% | 14.96% | 1.90% |
| Mid Cap Core | -3.36% | -0.01% | 5.31% | 0.35% | 12.79% | -0.08% |
| Mid Cap Growth | -3.48% | -0.27% | 5.51% | -0.47% | 12.14% | -2.91% |
| Mid Cap Value | -3.88% | -0.48% | 3.77% | -0.78% | 11.61% | -0.36% |
| Small Cap Core | -3.22% | 0.06% | 2.84% | 1.11% | 10.79% | 0.74% |
| Small Cap Growth | -2.52% | 0.40% | 5.15% | 0.71% | 9.29% | 0.16% |
| Small Cap Value | -3.73% | -0.08% | 1.18% | 2.03% | 11.63% | 0.73% |
Data from Morningstar as of 6/30/2024. The Morningstar US Active Fund categories used in this analysis represent US-domiciled mutual funds and exchange-traded funds classified as actively managed by Morningstar. The asset classes are represented by (in order of table): Russell 1000 TR USD, Russell 1000 Growth TR USD, Russell 1000 Value TR USD, Russell Mid Cap TR USD, Russell Mid Cap Growth TR USD, Russell Mid Cap Value TR USD, Russell 2000 TR USD, Russell 2000 Growth TR USD, and Russell 2000 Value TR USD.
Actively managed U.S. equity funds struggled to outpace category benchmarks during the quarter. Two of these active management “wins” occurred in small cap categories, and none in mid caps. Large cap core and growth managers have struggled mightily over the past twelve months, and Q2 was no different.
Why have these asset classes been so difficult for stock-picking? The largest ten companies in the S&P 500 now comprise 37.5% of the index’s weighting. This concentration is far above the historical average. A worse level of concentration exists in the Russell 1000 Growth: Its ten biggest constituents comprise over 60% of the index! Active managers who created funds with similar levels of concentration would face potential regulatory issues. Because returns have been high but not broad-based in large cap core and growth indices, active managers have faced structural headwinds in these asset classes. One final data point worth noting: An equal-weighted version of the S&P 500 has underperformed its market capitalization-weighted counterpart by over 1000 basis points this year–highlighting the lack of broader market participation (typically a headwind for active managers).
Non-U.S. Equity
| Active Fund Category | Qtr Return | Vs. Benchmark | YTD Return | Vs. Benchmark | TTM Return | Vs. Benchmark |
|---|---|---|---|---|---|---|
| Developed Markets | 0.17% | 0.54% | 5.44% | 0.10% | 10.35% | -1.19% |
| Emerging Markets | 3.88% | -1.12% | 7.12% | -0.37% | 12.07% | -0.48% |
Data from Morningstar as of 6/30/2024. The Morningstar US Active Fund categories used in this analysis represent US-domiciled mutual funds and exchange-traded funds classified as actively managed by Morningstar. The asset classes are represented by (in the order of table): MSCI EAFE NR USD and MSCI EM NR USD.
Shifting to active equity management outside the U.S., we see mixed active management performance in Q2. While managers scored a collective victory in developed markets, they didn’t keep pace with the strong results in emerging markets. This mixed bag of success continues in our YTD assessment, but neither developed nor emerging market active managers have, in aggregate, beaten our benchmarks over the last twelve months. Geopolitical tensions and elections have created volatility in numerous international markets, thus creating a challenging environment for active management outperformance.
Fixed Income
| Active Fund Category | Qtr Return | Vs. Benchmark | YTD Return | Vs. Benchmark | TTM Return | Vs. Benchmark |
|---|---|---|---|---|---|---|
| Intermediate Bond | 0.23% | 0.17% | -0.25% | 0.47% | 3.11% | 0.48% |
| Short-Term Bond | 1.07% | 0.12% | 2.02% | 0.61% | 6.05% | 1.13% |
| Intermediate Muni | 0.28% | 0.70% | 0.44% | 1.23% | 3.74% | 1.48% |
| High Yield | 1.14% | 0.04% | 2.92% | 0.33% | 9.98% | -0.45% |
Data from Morningstar as of 6/30/2024. The Morningstar US Active Fund categories used in this analysis represent US-domiciled mutual funds and exchange-traded funds classified as actively managed by Morningstar. The asset classes are represented by (in order of table): Bloomberg US Agg Bond TR USD, Bloomberg US Agg 1-3 Yr TR USD, and Bloomberg Municipal 5 Yr 4-6 TR USD, Bloomberg US Corporate High Yield TR USD.
Active managers posted Q2 excess returns in all four fixed income asset classes tracked for this scorecard. This success continues for YTD results, too. Over the last twelve months, only high yield active managers have underperformed our benchmark for their asset class. Although low absolute levels of returns (given interest rate environment, active bond funds, overall, have performed quite well during a difficult time for many fixed income categories. Managers have navigated interest rate and credit risks to generate outperformance, especially this year. The next test for these funds will be dealing with a potential Federal Reserve easing cycle.
Diversifying Asset Classes
| Active Fund Category | Qtr Return | Vs. Benchmark | YTD Return | Vs. Benchmark | TTM Return | Vs. Benchmark |
|---|---|---|---|---|---|---|
| Commodities | 1.63% | -1.26% | 5.52% | 0.38% | 6.69% | 1.69% |
| Real Estate | -0.73% | -0.57% | -1.49% | -0.94% | 5.42% | -1.73% |
| TIPS | 0.78% | -0.01% | 0.83% | 0.13% | 3.30% | 0.59% |
| Bank Loan | 1.63% | -0.27% | 4.01% | -0.40% | 10.35% | -0.77% |
Data from Morningstar as of 6/30/2024. The Morningstar US Active Fund categories used in this analysis represent US-domiciled mutual funds and exchange-traded funds classified as actively managed by Morningstar. The asset classes are represented by (in order of table): Bloomberg Commodity TR USD, DJ US Select REIT TR USD, BBgBarc US Treasury US TIPS TR USD, and Morningstar LSTA LL TR USD.
Finally, let’s examine diversifying asset classes. These idiosyncratic categories proved to be difficult for active funds in Q2 with no aggregate wins for the managers. Over the YTD and TTM timeframes, however, we find that active commodities and TIPS managers have yielded outperformance. Real estate funds, meanwhile, have struggled with the greatest underperformance.
Factor update
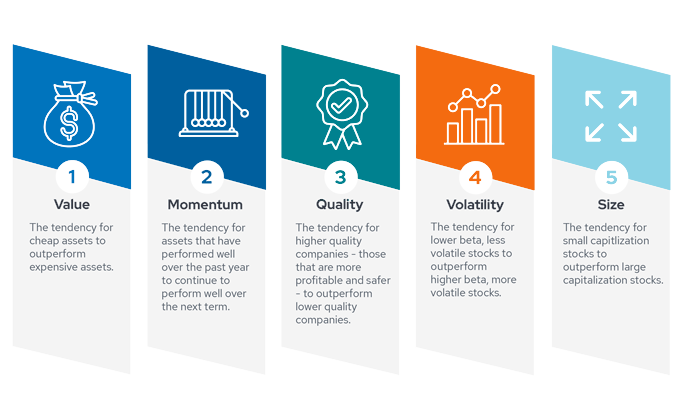
Below, we examine the performance of the five key factors (described by the infographic) in the current market environment.


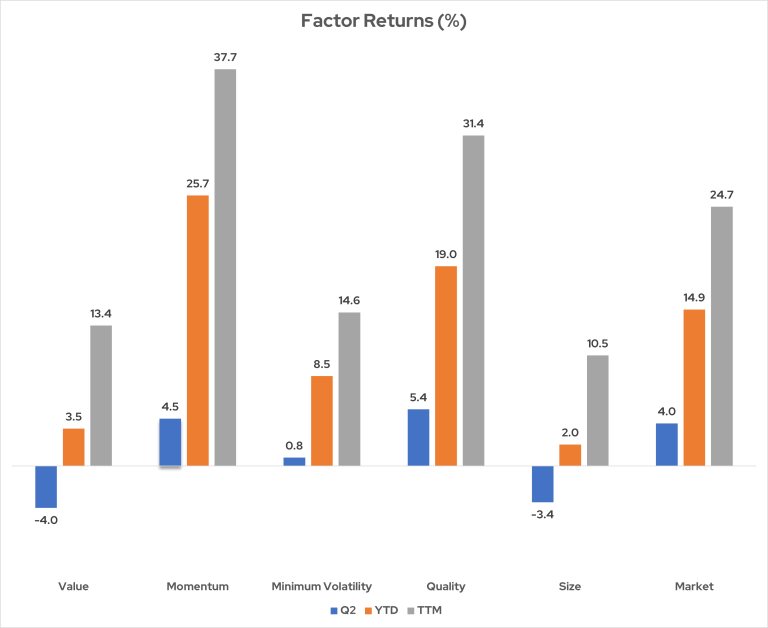
These indices represent US factor returns: MSCI USA Enhanced Value, MSCI USA Momentum, MSCI USA Minimum Volatility, MSCI USA Quality, MSCI USA Small Cap, and MSCI USA GR USD. As of 6/30/2024. Data source: Morningstar.
- Q2 saw mixed factor performance as only the Momentum and Quality factors beat the market.
- The Value and Size factors lost ground in Q2, while the Minimum Volatility factor eked out a small gain.
- The continued strength of highly profitable large cap growth stocks explains the Q2 factor performance. The U.S. equity market has been driven by a small number of stocks, and this narrow breadth impacts multiple factors.
- Q2 largely represents a microcosm of year-to-date and trailing twelve month returns. Over these longer timeframes, we see the Momentum and Quality factors beating the market, middling results from Minimum Volatility, and the Size and Value factors lagging. For well over a year, market gains have been led by a concentrated few large cap companies (predominately in the technology sector), and this phenomenon has created a wide dispersion in factor returns.
- Note that the Market factor is equivalent to beta in this analysis.
The power of both active and passive management
This update on active and passive management covers a relatively short timeframe, but Envestnet | PMC has a long history of research and portfolio management using our ActivePassive methodology. This framework requires patience and a deep understanding of cyclical trends. Ultimately, though, we believe there is a place and a time for both active and passive management.
For more information on Envestnet | PMC, please visit www.investpmc.com.

