Envestnet | PMC is an industry pioneer in blending the two opposing investment styles: active and passive. We have been implementing this approach within client portfolios well before the asset flow dominance into passive vehicles in recent years. We leverage Envestnet | PMC’s core competencies of manager research and due diligence, manager selection, asset allocation, and active/passive research to engage with our clients. We know active management is cyclical, but we are firm advocates of active strategies. We recognize the benefits of passive investing, too.
Market overview
The first quarter of 2025 was a whirlwind for investors, as markets soared early on only to be swiftly derailed by rising economic uncertainty and shifting U.S. policies. After a promising start, with the S&P 500 Index up 3.9% through mid-February, sentiment quickly soured under the weight of new tariffs, stricter immigration policies, and reduced federal spending. The Trump administration’s new tariffs—targeting Canada, Mexico, and the auto industry—weighed heavily on markets, prompting downward revisions to GDP growth and stoking inflation concerns. Investors rotated out of high-growth, richly valued names into more defensive sectors like Energy, Utilities, and Healthcare, while mega-cap tech stocks, including the once high-flying Magnificent Seven, tumbled 14.8% year-to-date. By quarter-end, the S&P 500 Index had tumbled 4.27%, with March alone wiping out 5.63%. International equities outperformed their U.S. counterparts, with strong rallies in Chinese and European markets, and value stocks took the lead, though small caps remained under pressure, extending their prolonged underperformance. The U.S. dollar weakened, as policy uncertainty clouded the outlook for the U.S. economy. The traditional relationship between stocks and bonds resurfaced in the first quarter, as bonds served as a safe haven. Their prices rose despite the Federal Reserve holding off on cutting interest rates—a sharp contrast with the fourth quarter, when stocks soared as bonds struggled. Treasury yields were volatile, and spreads widened broadly. Yields on the 10-year Treasury note dropped to 4.23% at the end of the quarter after peaking at 4.79% in early January. While U.S. Treasuries benefited from economic uncertainty and falling yields, global bond markets displayed mixed dynamics influenced by regional policies and geopolitical shifts. Spread sectors lagged Treasuries, but investment grade bonds held up better than their high yield counterparts as equities tumbled. Commodities were among the best-performing asset classes, led by precious metals, with gold, silver, and copper posting strong price gains. In the end, the quarter served as a vivid reminder that in turbulent times, diversification across asset classes and investment styles remains one of the best defenses.
Our scorecard
Our ActivePassive Scorecard shows active funds beating their category benchmarks in six of the 19 asset classes we tracked for the first quarter. Over past 12 months, active funds led their category benchmarks in five of these analyzed asset classes.
Active managers delivered a mixed bag of results in the first quarter with U.S equity managers producing the best relative results. In fact, active managers outperformed in only one asset class outside of the U.S. equity complex in Q1. Over the past 12 months, we see less concentrated active strategy outperformance, though. Still, active managers outperformed in just over ¼ of the asset classes tracked for this scorecard over the trailing 12 months (TTM) timeframe. Let’s delve into the performance details.
U.S. Equity
| Active Fund Category | Qtr Return | Vs. Benchmark | TTM Return | Vs. Benchmark |
|---|---|---|---|---|
| Large Cap Core | -3.78% | 0.71% | 5.19% | -2.63% |
| Large Cap Growth | -8.63% | 1.34% | 4.66% | -3.10% |
| Large Cap Value | 1.46% | -0.67% | 6.28% | -0.90% |
| Mid Cap Core | -4.24% | -0.84% | -0.03% | -2.63% |
| Mid Cap Growth | -8.34% | -1.22% | -2.58% | -6.16% |
| Mid Cap Value | -2.23% | -0.12% | 0.68% | 1.59% |
| Small Cap Core | -7.99% | 1.49% | -3.82% | 0.18% |
| Small Cap Growth | -10.64% | 0.48% | -4.61% | 0.25% |
| Small Cap Value | -7.32% | 0.43% | -3.76% | -0.64% |
Data from Morningstar as of 3/31/2025. The Morningstar US Active Fund categories used in this analysis represent US-domiciled mutual funds and exchange-traded funds classified as actively managed by Morningstar. The asset classes are represented by (in order of table): Russell 1000 TR USD, Russell 1000 Growth TR USD, Russell 1000 Value TR USD, Russell Mid Cap TR USD, Russell Mid Cap Growth TR USD, Russell Mid Cap Value TR USD, Russell 2000 TR USD, Russell 2000 Growth TR USD, and Russell 2000 Value TR USD.
U.S. equity managers delivered strong relative performance in small cap asset classes, as well as the large cap core and growth categories, during Q1. The large cap realm had been extremely challenging for active managers due to the concentrated returns generated by the Magnificent Seven stocks. As the Magnificent Seven stumbled, however, active managers erased some of their collective underperformance. Value equities benefited from the market rotation in the first quarter, as growth stocks fell sharply while value posted gains. The Russell 3000 Value Index advanced 1.64%, outperforming the Russell 3000 Growth Index by a notable 11.64%. Growth’s winning streak came to an abrupt halt, as technology stocks that propelled the market higher for the better part of two years became a drag on performance in the first quarter. Still, large and mid cap value managers lagged our benchmarks in Q1. In fact, mid cap managers struggled overall last quarter and slipped further behind our asset class benchmarks.
Small cap managers, however, broadly excelled in the first quarter. While small cap equities largely faltered in Q1, many managers stemmed the losses at least somewhat. We often find that active strategies benefit from highly developed risk management techniques that can aid them during market downturns. When the market keeps climbing higher with low volatility, risk management cannot shine as it does when corrections occur.
Over the last 12 months, only small cap core and growth managers have produced aggregate outperformance in the U.S. equity market. Mid cap managers have struggled the most over this time period. As the domestic stock market continues to endure heightened volatility, we will see if active managers outperform at a higher rate.
Non-U.S. Equity
| Active Fund Category | Qtr Return | Vs. Benchmark | TTM Return | Vs. Benchmark |
|---|---|---|---|---|
| Developed Markets | 6.54% | -0.32% | 6.26% | 1.38% |
| Emerging Markets | 1.57% | -1.36% | 4.16% | -3.93% |
Data from Morningstar as of 3/31/2025. The Morningstar US Active Fund categories used in this analysis represent US-domiciled mutual funds and exchange-traded funds classified as actively managed by Morningstar. The asset classes are represented by (in the order of table): MSCI EAFE NR USD and MSCI EM NR USD.
International equities generated positive returns in the first quarter, unlike domestic stocks. Developed market equities, particularly in Europe, delivered the best results of the international universe. Overall, though, active managers struggled to keep pace with our benchmarks. While some active international equity strategies excelled in Q1, developed and emerging market funds underperformed in aggregate, with the latter group lagging our benchmark by almost 1.4%. The MSCI China index rose just over 15% in Q1, and emerging market funds that were underweight Chinese equities faced significant headwinds.
Over the past 12 months, developed markets managers have exceeded our benchmark’s return while active emerging markets funds have lagged by over 3.9%. The return dispersion among international equity funds has historically been higher than among U.S. large cap equity strategies. This makes manager selection important in international equity asset classes.
Fixed Income
| Active Fund Category | Qtr Return | Vs. Benchmark | TTM Return | Vs. Benchmark |
|---|---|---|---|---|
| Intermediate Bond | 2.64% | -0.14% | 4.98% | 0.10% |
| Short-Term Bond | 1.65% | 0.02% | 5.89% | 0.28% |
| Intermediate Muni | -0.05% | 0.97% | 1.75% | -0.72% |
| High Yield | 0.74% | -0.26% | 6.61% | -1.09% |
Data from Morningstar as of 3/31/2025. The Morningstar US Active Fund categories used in this analysis represent US-domiciled mutual funds and exchange-traded funds classified as actively managed by Morningstar. The asset classes are represented by (in order of table): Bloomberg US Agg Bond TR USD, Bloomberg US Agg 1-3 Yr TR USD, and Bloomberg Municipal 5 Yr 4-6 TR USD, Bloomberg US Corporate High Yield TR USD.
All four fixed income asset classes tracked in this scorecard rose in Q1, and active strategies delivered positive returns in 3/4 of these categories. While longer-duration securities outperformed in the first quarter, the short-term bond asset class is where active strategies beat our benchmark. Unlike Q4, though, last quarter did not lead to widespread active management outperformance in the bond asset classes tracked for this report. When assessing these results, recall that fixed income managers don’t just rely on yield curve bets to generate active returns. Security selection—not bold bets on future interest rates—is the focus of many active bond strategies. For this reason, interest rate fluctuations do not drive all of the active bond fund results.
From a TTM perspective, intermediate and short-term active strategies have beaten our benchmarks. These are taxable fixed income asset classes that enable managers to select holdings from a wide spectrum of securities and issuers. Active managers have underperformed in the intermediate municipal bond and high yield asset classes across this timeframe, though. Muni returns have been modest over the past year, and high yield bonds have delivered limited spreads above investment-grade securities. In fact, high yield funds have only delivered 72 basis points of additional returns over short-term bond funds during the TTM period (based on category averages). That is an unusually low spread considering the greater potential risk in high yield securities. If the economy cools, this spread may widen. A significant recession would likely create additional high yield defaults, though.
Diversifying Asset Classes
| Active Fund Category | Qtr Return | Vs. Benchmark | TTM Return | Vs. Benchmark |
|---|---|---|---|---|
| Commodities | 7.57% | -1.31% | 9.16% | -3.12% |
| Real Estate | 0.82% | -0.35% | 8.27% | -1.53% |
| TIPS | 3.78% | -0.38% | 5.96% | -0.21% |
| Bank Loan | 0.22% | -0.26% | 6.16% | -0.70% |
Data from Morningstar as of 3/31/2025. The Morningstar US Active Fund categories used in this analysis represent US-domiciled mutual funds and exchange-traded funds classified as actively managed by Morningstar. The asset classes are represented by (in order of table): Bloomberg Commodity TR USD, DJ US Select REIT TR USD, BBgBarc US Treasury US TIPS TR USD, and Morningstar LSTA LL TR USD.
In Q1, the commodities asset class was the top-performing investment category tracked in this scorecard. Over the past 12 months, commodities and real estate were the top-two asset classes tracked in this report (when ranking asset classes by benchmark and active fund aggregate returns). These data points illustrate the potential opportunities for diversification using these alternative asset classes (and others). Despite the positive results for our diversifying asset classes in the first quarter and over the last year, active managers did not produce aggregate outperformance in any of these four categories. That said, return dispersion in the commodities and real estate asset classes can be quite significant, and some managers have excelled in these sectors of the investment world. Manager selection in the TIPS (Treasury Inflation Protected Securities) and bank loan categories can be important, too. All of these asset classes except for TIPS have unique characteristics that can limit access through passive strategies, however that is especially true for bank loans.
Factor update
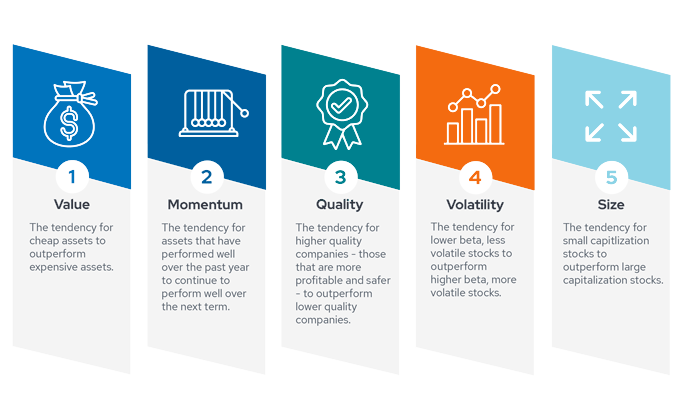
Below, we examine the performance of the five key factors (described by the infographic above) in the current market environment. This analysis is relevant to our scorecard because factors are integral to many active management strategies.
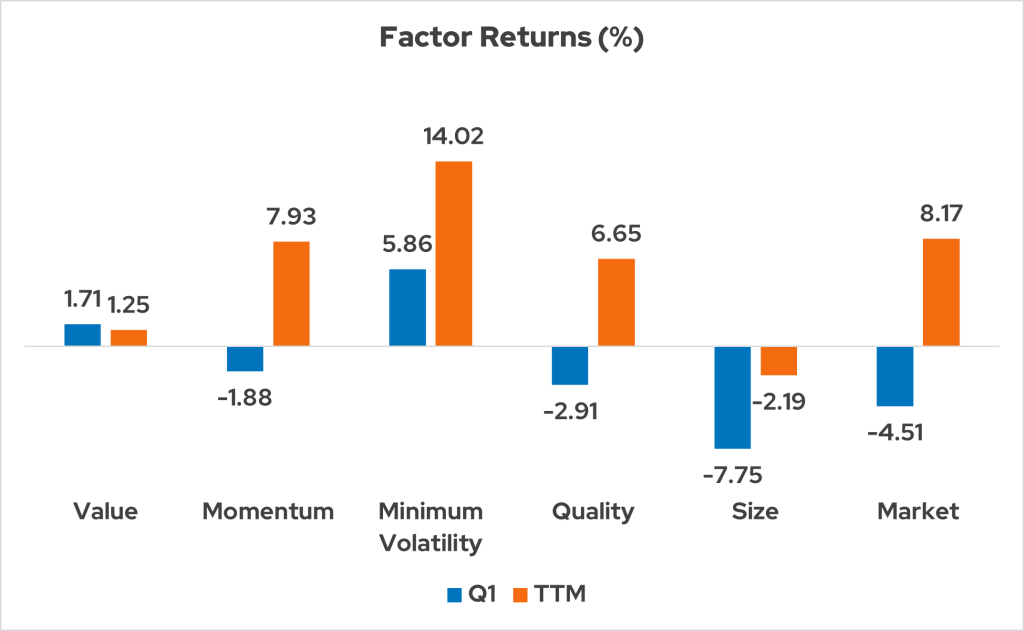
These indices represent US factor returns: MSCI USA Enhanced Value, MSCI USA Momentum, MSCI USA Minimum Volatility, MSCI USA Quality, MSCI USA Small Cap, and MSCI USA GR USD. As of 3/31/2025. Data source: Morningstar.
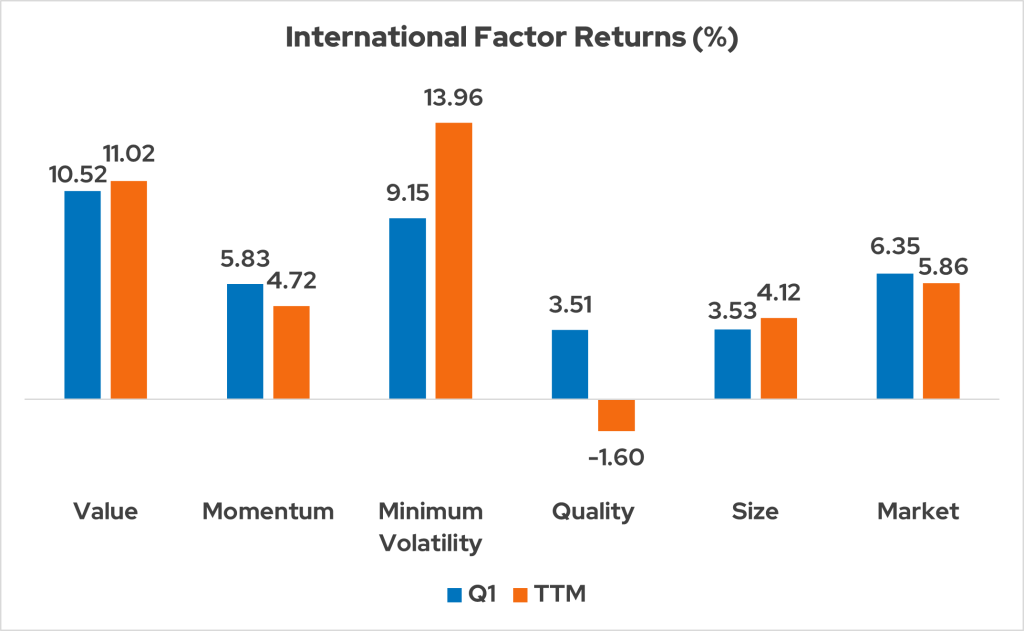
These indices represent international factor returns: MSCI ACWI Ex-US Momentum, MSCI ACWI Ex-US Enhanced Value, MSCI ACWI Ex-US Quality, MSCI ACWI Ex-US Small Cap, MSCI ACWI Ex-US Minimum Volatility, and MSCI ACWI Ex-US GR USD. Data source: Morningstar. As of 3/31/25.
- Q1 brought losses to three of the key U.S. factors tracked in this scorecard, in addition to a decline in the overall U.S. market. In keeping with their historical tendencies, the Minimum Volatility and Value factors performed well despite the weakening domestic equity environment.
- International factor performance was much stronger than in the U.S. with all five major factors delivering positive results. The Minimum Volatility and Value factors provided the greatest international outperformance, just as they did in the U.S. While factor performance is not always correlated on a global basis, trends like this one are not uncommon.
- Over the past 12 months, the Minimum Volatility factor has delivered the highest returns on a global basis. This is an unusual result since U.S. and international markets have delivered solid gains during this time period. Historically, the Minimum Volatility factor has been more likely to lead in weak markets.
Value in both active and passive management
This update on active and passive management covers a relatively short timeframe, but Envestnet | PMC has a long history of research and portfolio management using our ActivePassive methodology. This framework requires patience and a deep understanding of cyclical trends. Ultimately, though, we believe there are places and times for both active and passive management.
For more information on Envestnet | PMC, please visit www.investpmc.com.
