|
Welcome to ENV 2 Insider, your monthly e-newsletter for quick tips on how to take advantage of your new, robust platform.
Tip of the Month
New Charts in Research Center
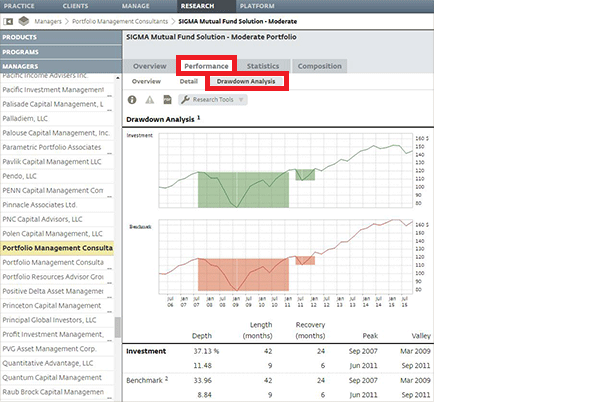
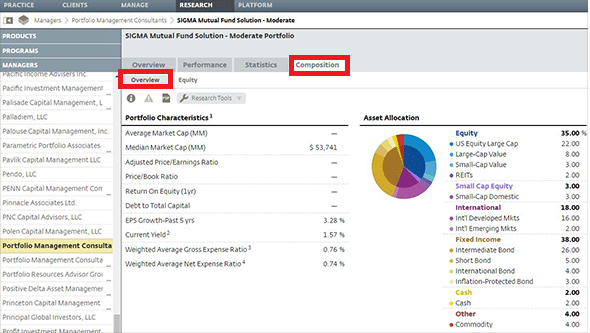
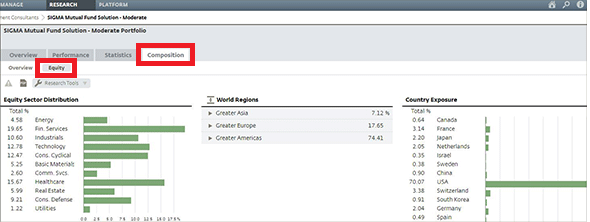
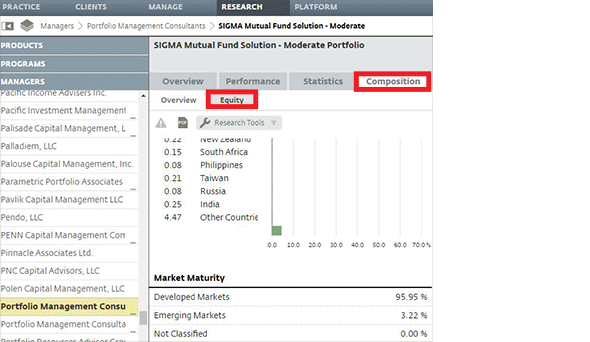
Graphics are useful tools to present investment selections to your clients and discuss performances. Over the last year, ENV 2 added a few new charts to product profiles in the Research Center at your disposal.
1. Drawdown Analysis chart under the Performance tab
2. Asset Allocation chart under the Composition tab
3. Country Exposure graph under the Composition tab
4. Market Maturity table under the Composition tab
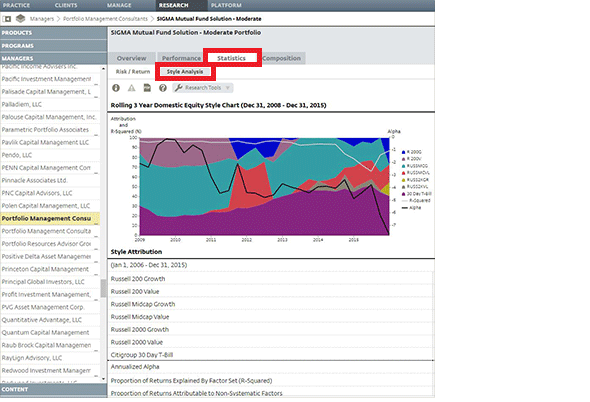
5. Style Analysis chart under the Statistics tab
Feature Spotlight
Enhanced Charts in Research Center
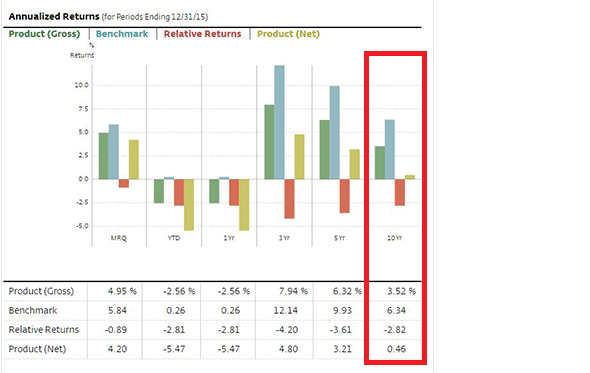
Did you know analytical reports in the Research Center have been updated to provide 10 years of historical performance data?
The Equity Sector Distribution chart has also been enhanced to show all equity sectors for a product. You can access the chart from the Composition tab in the product profile.

The information and analysis expressed herein is for general and educational purposes only and is not intended to constitute legal, tax, securities, or investment advice. The graphical illustrations contained herein do not represent any client information or actual investments. The information provided is based on currently available information as of the date of this writing and may be subject to change at any time without prior notice. Envestnet makes no representation that the information provided is accurate, reliable or error-free. Envestnet reserves the right to add to, change, or eliminate any of the services listed herein without notice.
FOR ADVISOR USE ONLY - NOT FOR PUBLIC USE
© 2016 Envestnet, Inc. All rights reserved.
|